Psychiatrist Salary by State: 2026 Data and FIRE Projections
Explore 2026 psychiatrist salary by state with BLS data, cost-of-living context, and FIRE projections to find burnout-friendly roles that fit your financial

North Dakota's $390,140 mean annual psychiatrist wage and West Virginia's $132,510 are separated by more than $257,000, based on BLS-derived state salary summaries from different reporting periods. That spread is large enough to change a physician's relocation decision, debt payoff strategy, and potential FIRE timeline, but it's also easy to misread. A state average can reflect a small workforce, an unusual mix of inpatient and outpatient roles, or a handful of highly compensated positions rather than the offer you're likely to receive.
The useful question isn't just, “Which state pays psychiatrists the most?” It's, “Which combination of pay, provider scarcity, practice setting, taxes, living costs, schedule, and employment stability gives me the strongest professional life?” The psychiatrist salary by state data can answer part of that question. It can't answer it alone.
Why Psychiatrist Pay Varies So Wildly Across States
The BLS 2023 May release illustrates the problem immediately. The District of Columbia recorded an annual mean wage of $156,300, while independent summaries of the same BLS dataset listed North Dakota at $390,140 and California at $311,950. Those figures come from the BLS occupational employment and wage table for psychiatrists, and they show why psychiatry compensation is a localized labor-market measure, not a single national price.
Geography matters, but it isn't the mechanism. Employers pay more when recruiting psychiatrists is difficult, when the available roles involve demanding coverage, or when a state's practice mix includes unusually well-paid positions. A state with few psychiatrists can produce a high mean wage because a limited number of openings or senior roles materially influence the average.
Scarcity changes the negotiating balance
Psychiatry's workforce is small in employment terms in many states. That creates a statistical problem and a practical advantage. Statistically, a small number of observations can move the state mean quickly. Practically, a physician entering a shortage market may have more bargaining power than the headline average suggests.
Practice mix also matters. A state with a concentration of hospital, inpatient, correctional, academic, or specialty positions won't produce the same compensation profile as a state dominated by lower-overhead outpatient work. Academic medical center concentration can raise some averages, while a large community mental-health footprint can pull other averages in a different direction.
BLS has maintained this occupational series across annual releases, including 2019, 2021, 2022, and 2023, which allows year-to-year comparison in the public OES archive cited above. But comparison requires discipline. A change in ranking may reflect a changed workforce composition or reporting conditions, not a clean increase in what every psychiatrist earns.
Practical rule: Treat a state mean as a market signal. Treat a specific offer, including schedule and total compensation, as the decision-grade evidence.
That distinction protects you from two common errors. First, you might reject a state with a modest average even though a shortage-driven employer offers unusually strong terms. Second, you might chase a high average that comes from a thin and unstable market, only to discover that the available role includes call, weekends, or an unsustainable patient load.
Highest and Lowest Paying States for Psychiatrists
State rankings are useful as a screening tool, not as a promise. The figures below combine BLS data and BLS-derived summaries from different reporting periods, so the data year matters. They shouldn't be read as one synchronized national ranking.
Selected state benchmarks
| State | Mean Annual Wage | Data Year |
|---|---|---|
| North Dakota | $390,140 | 2023 |
| California | $311,950 | 2023 |
| Connecticut | $338,620 | 2024 summary |
| Indiana | $295,510 | 2024 summary |
| West Virginia | $132,510 | 2024 summary |
| Alabama | $186,460 | 2024 compilation |
| Hawaii | $153,630 | 2024 compilation |
| District of Columbia | $156,300 | 2023 |
The 2024 state-by-state psychiatrist pay summary lists Connecticut at $338,620, Indiana at $295,510, California at $288,270, and West Virginia at $132,510 in its most recent BLS employment survey summary. The same coverage demonstrates why rankings shift across reporting periods. A 2023 BLS-based ranking placed North Dakota first at $390,140 and California second at $311,950, while another 2024 compilation listed Alabama at $186,460 and Hawaii at $153,630.
Read the outliers as clues
North Dakota's position points toward scarcity and geographic isolation rather than a universal regional premium. California's high placement reflects a large and complex market, but its nominal wage doesn't automatically translate into superior purchasing power. Connecticut and Indiana show that high compensation can appear in very different labor-market contexts, while West Virginia, Alabama, Hawaii, and the District of Columbia remind us that a lower mean doesn't describe every local offer.
The spread between Connecticut and West Virginia in the 2024 summary exceeds $206,000, according to the cited Becker's Behavioral Health coverage. That's enough to justify deeper investigation, but not enough to support a relocation decision without reviewing taxes, housing, schedule, benefits, and employment concentration.
Use the table to identify markets worth researching, then compare actual opportunities through a personalized salary and market analysis. A state benchmark can frame a negotiation, while a contract-specific calculation should determine whether the move works for you.
Employment Concentration and Location Quotient Explained
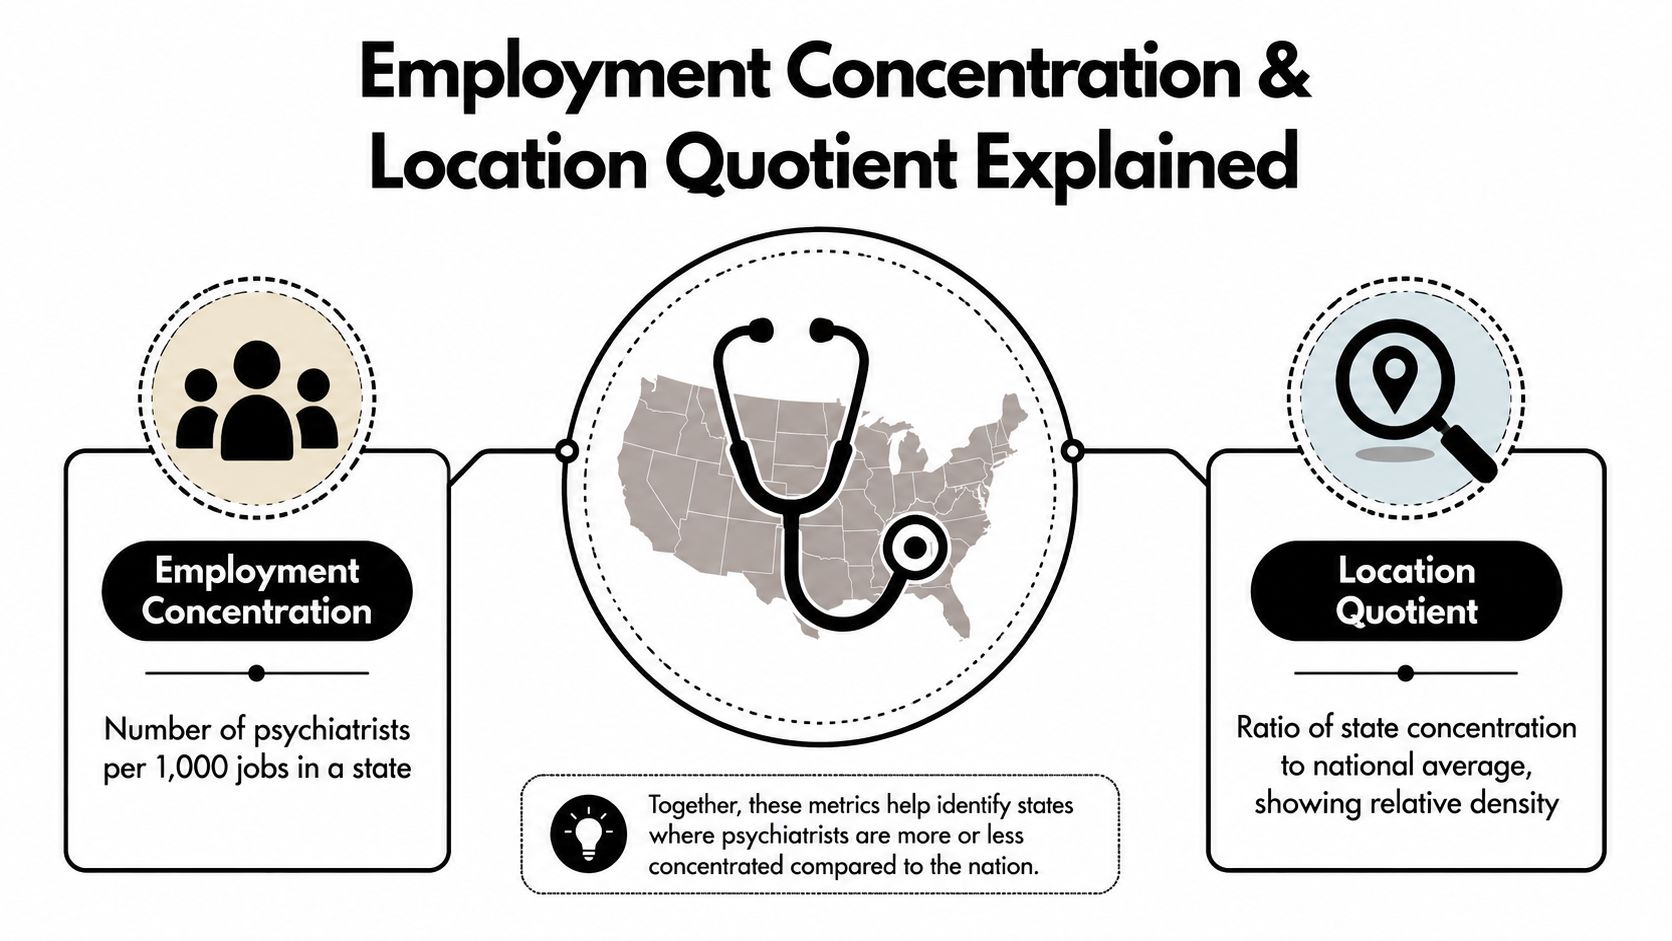
Salary guides often foreground the wage and hide the denominator. That's a mistake. BLS state tables also report employment per thousand jobs and location quotient, two measures that help distinguish a broad labor market from a concentrated one.
Employment density asks how many psychiatrists work relative to the state's total jobs. Location quotient compares that concentration with the national pattern. A higher location quotient means psychiatry represents a larger share of the state's employment mix than it does nationally. Neither measure tells you whether an individual offer is good, but together they reveal whether a wage is emerging from a deep market or a narrow one.
California and Missouri show why the denominator matters
In BLS 2022 data, California had 5,630 employed psychiatrists, employment density of 0.32 per thousand jobs, a location quotient of 1.78, and a $149.97 hourly mean wage. Missouri had a smaller workforce but a higher $156.17 hourly mean wage. Those figures appear in the BLS 2022 psychiatrist employment and wage table.
The comparison challenges a simple cost-of-living explanation. California has a large psychiatric workforce and a meaningful concentration relative to the national pattern, yet Missouri's hourly mean was higher in that dataset. Localized shortages can raise pay even in a state that doesn't dominate national headlines.
A small-workforce state can therefore be either attractive or risky. It may offer real bargaining power because employers struggle to recruit. It may also produce an unstable average that doesn't represent a deep selection of comparable jobs.
Pair wage with market depth
For a practical review, ask three questions:
- How large is the workforce? A small employment count makes the average more sensitive to individual roles.
- How concentrated is psychiatry? Employment density and location quotient show whether the specialty has an unusual presence in the state.
- What role produced the wage? Separate outpatient, inpatient, academic, correctional, emergency coverage, and hybrid arrangements before comparing offers.
The correct benchmark isn't annual mean wage by itself. It's annual mean wage paired with concentration, then adjusted for setting and schedule.
Cost of Living Adjustments That Change the Rankings
A salary has no fixed lifestyle value. Housing, taxes, transportation, childcare, insurance, and everyday expenses determine how much income remains available for saving and spending. That's why a nominally lower offer can produce more financial flexibility than a higher one in an expensive metro area.
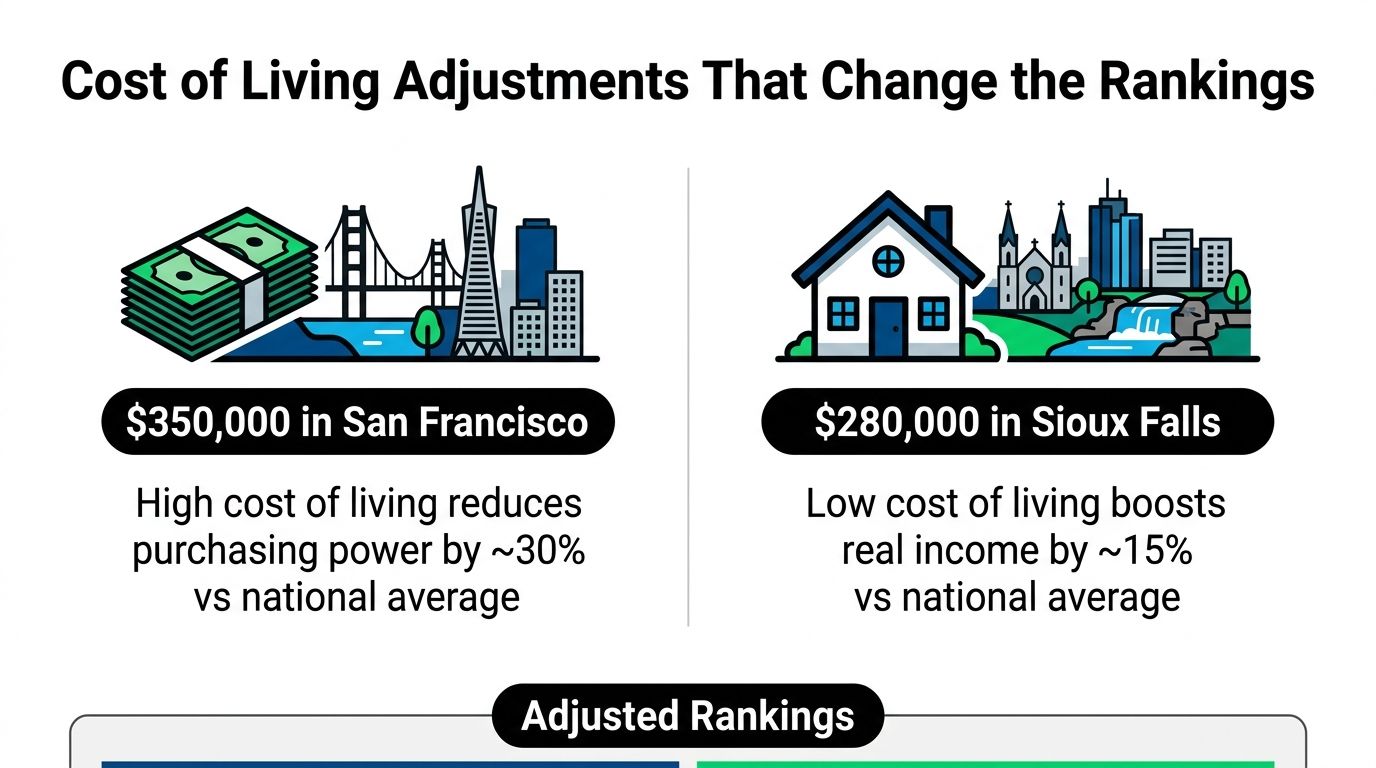
The contrast between $350,000 in San Francisco and $280,000 in Sioux Falls is useful as a conceptual comparison, not as a verified state wage benchmark. The first salary may support a more constrained housing and savings strategy, while the second may leave greater room for wealth building. You shouldn't assume the larger number wins before calculating the household budget.
Compare purchasing power, not prestige
High-cost states can still be excellent choices. They may offer professional networks, academic opportunities, cultural amenities, family support, or a partner's career advantages. The analytical error is assuming those benefits are funded by the salary automatically.
For each target market, build a parallel budget:
- Start with guaranteed base compensation.
- Subtract federal, state, and local taxes where applicable.
- Price housing at the neighborhood level, not the state level.
- Add malpractice, licensing, commuting, childcare, and health-plan costs.
- Calculate the amount available for debt reduction and investments.
- Divide that result by expected clinical hours to estimate an effective lifestyle-adjusted hourly value.
The cost-of-living adjustment guide can help you frame the comparison, but your own household expenses should control the final decision.
Interior markets can win on wealth accumulation
The BLS-derived rankings already show why geography and purchasing power can diverge. California appeared at $311,950 in the 2023 summary, while North Dakota appeared at $390,140, according to the cited BLS release and its independent summary. The gap may reflect scarcity and practice mix, but the lower-cost market can also make the wage more valuable after expenses.
Don't reduce the decision to coastal versus interior. Compare a specific metro, a specific role, and a specific schedule. The state ranking is only the first pass.
Negotiating Contracts with State Salary Data
A state average becomes useful when you turn it into a negotiation brief. Bring context, not just a large number. Employers can dismiss an unsupported claim that “the state average is higher,” but they have a harder time ignoring a structured comparison showing wage benchmarks, workforce concentration, responsibilities, and schedule.
Build a defensible benchmark
Start with the applicable BLS state figure and identify its data year. Then add the local facts that affect the role:
- Employment concentration: Explain whether the state has a thin or concentrated psychiatrist workforce.
- Practice setting: Compare outpatient, inpatient, academic, correctional, and integrated-care responsibilities separately.
- Clinical intensity: Clarify panel size, follow-up expectations, medication management volume, documentation, and supervision.
- Schedule burden: Price call, weekends, overnight coverage, and mandatory availability as compensation variables.
- Total package: Include retirement contributions, malpractice and tail coverage, CME, relocation, loan support, and paid time off.
Use the salary negotiation tactics guide to organize the discussion around evidence and priorities rather than a single demand.
Put burnout protection into the contract
A weekday-only schedule isn't a soft preference. It changes the value of the position, particularly when a competing role has similar base pay but requires call or weekend coverage. Ask for precise language rather than relying on a recruiting conversation.
You might say:
“The state benchmark supports the base range I'm requesting. Because this position excludes weekend and overnight coverage, I'd like those schedule protections written into the agreement, along with a clear process for any future change.”
If the employer can't move on salary, negotiate terms that protect your time. A defined no-call schedule, predictable clinic hours, administrative support, protected documentation time, or a transparent productivity formula may improve the offer more than a modest increase in nominal pay.
Review the agreement with a specialist before signing. A contract scanner can flag restrictive clauses, termination language, repayment obligations, and compensation ambiguity, but it shouldn't replace legal advice.
How Telepsychiatry Is Reshaping State Pay Benchmarks
Telepsychiatry weakens the old assumption that your home state determines your compensation. A remote role may be priced according to the employer's market, the patient's location, a national compensation framework, or a blended model. The job can be physically located in one state while the labor-market logic comes from another.
That creates a new comparison problem. A psychiatrist living in a lower-cost area may access an employer with higher-market compensation, but the arrangement still depends on licensing, patient-location rules, tax treatment, malpractice coverage, and the employer's scheduling model.
Ask which geography controls the pay
Before comparing a telepsychiatry offer with a local position, ask:
- Where must you hold an active license?
- Where are patients located during visits?
- Does the employer adjust pay by clinician location, patient location, or service line?
- Are taxes withheld according to your work location or another jurisdiction?
- Who covers licensing fees and malpractice?
- Does “remote” mean flexible daytime work, or fixed shifts with evening and weekend obligations?
These questions often matter more than the state name in the listing. A national rate can make state salary tables less predictive, while a locally adjusted telehealth model may track state benchmarks closely.
Location arbitrage has limits
Living in a lower-cost state while earning compensation tied to a higher-paying market can improve savings capacity, but it isn't free arbitrage. Licensing costs, travel requirements, tax residency, patient access rules, and clinical support can erase part of the apparent advantage.
Use state data as a reference point when the employer explicitly prices roles geographically. When the employer uses a national or patient-based rate, evaluate the offer through total compensation and workload instead. Remote work changes the geography of pay, but it doesn't eliminate the operational geography of healthcare.
FIRE Projections by State for Psychiatrists
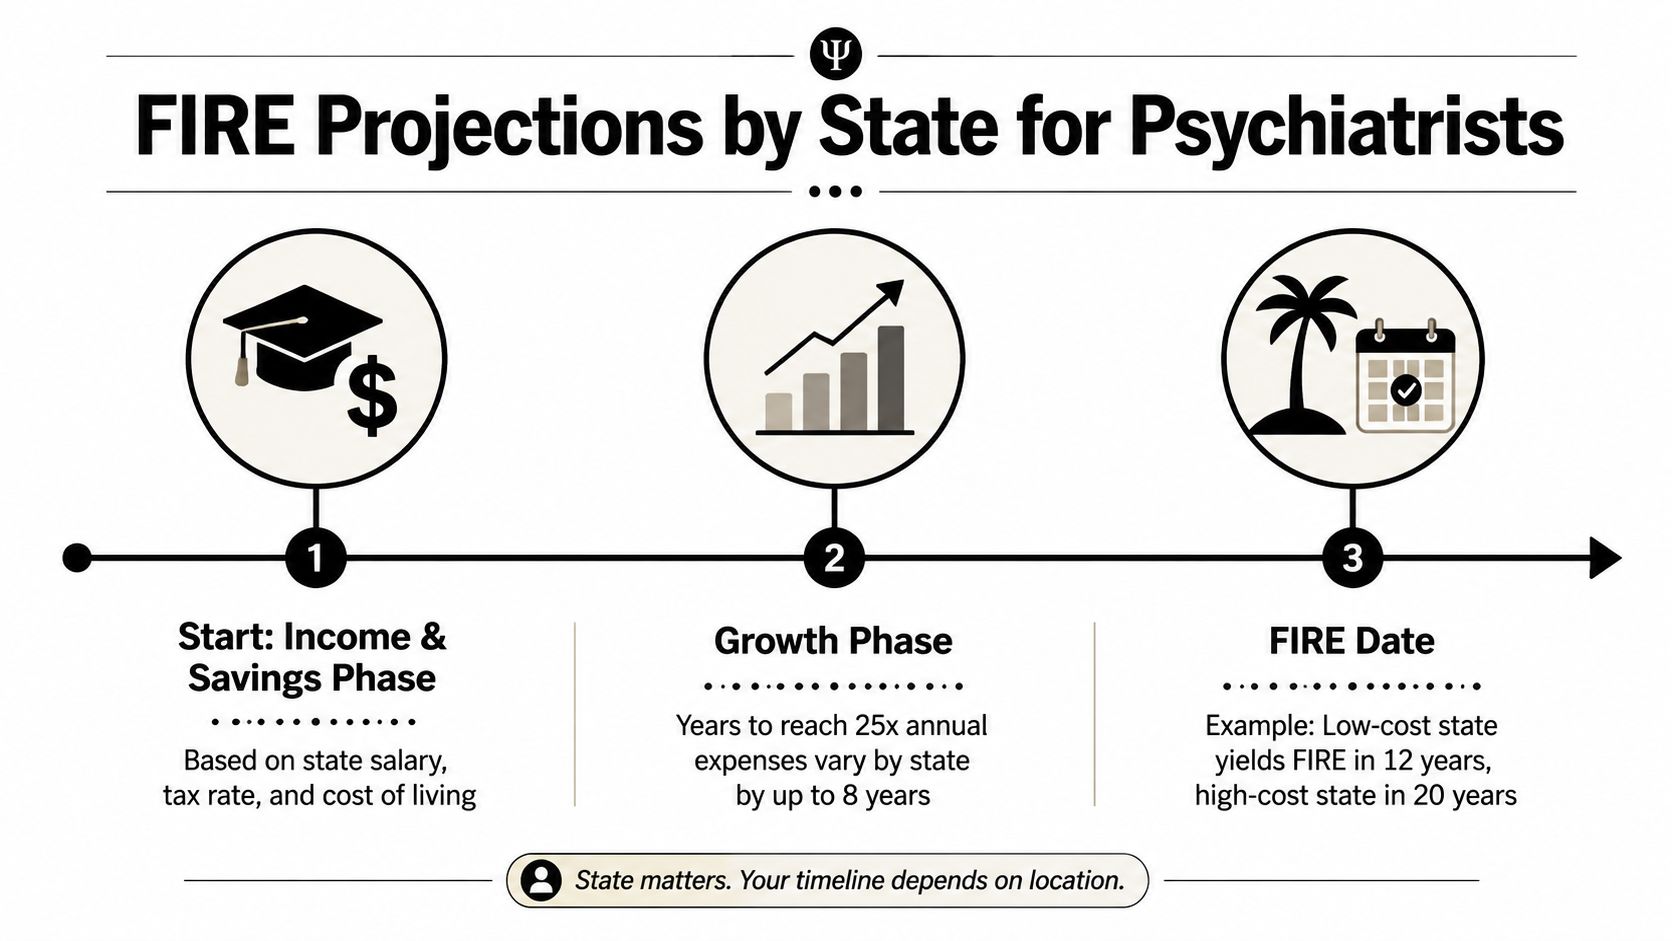
FIRE planning turns salary comparison into a time question. The relevant output isn't annual income. It's how much you can invest after taxes and living costs, how consistently you can maintain that savings rate, and how long the job remains tolerable.
A practical projection starts with three inputs: net income, annual expenses, and investable savings. You then test how changing the state, practice setting, or schedule affects the amount invested each year. The familiar “25 times annual expenses” target is a planning convention, not a guarantee, and it should be stress-tested against career breaks, family obligations, market volatility, and healthcare costs.
The higher salary can lose the FIRE race
Suppose two psychiatrists earn different salaries but face different housing and tax burdens. The higher-paid clinician may invest less each year if expenses consume the difference. The lower-paid clinician may reach financial independence sooner through lower fixed costs, a shorter commute, and a schedule that supports sustained full-time work.
State tax treatment belongs in the model, but it shouldn't dominate it. Housing and work intensity can affect savings just as sharply, while burnout can interrupt the income stream that makes the projection work.
Build scenarios rather than one forecast:
- Maximum income: Higher clinical intensity, more call, faster accumulation if you can sustain it.
- Balanced accumulation: Weekday schedule, moderate expenses, and a savings rate you can maintain.
- Geographic flexibility: Remote or hybrid work paired with a lower-cost home market.
- Semi-retirement: Reduced clinical hours after reaching a partial financial target.
A salary and FIRE calculator can help you compare these scenarios using your own expenses and compensation assumptions. Don't treat any output as a promise. Treat it as a decision model that shows which variables deserve attention.
Finding Burnout-Friendly Roles That Match Your Salary Goals
A high salary isn't a successful outcome if the job makes you leave clinical practice early. Evaluate compensation and workload together, because a schedule that protects recovery can preserve income over a longer career.
Start with the essentials. If you want weekday-only work, filter out roles with implicit availability requirements even when the listing says “no call.” Ask whether weekends are actually excluded, whether messages require after-hours response, and whether vacation coverage creates substitute call.
Use a two-axis screen
Create two columns before reviewing jobs:
Financial fit should include guaranteed salary, bonus mechanics, benefits, retirement contributions, malpractice, commuting costs, and expected savings.
Sustainability fit should include call, weekends, overnight work, patient volume, documentation time, administrative support, schedule control, and the emotional intensity of the caseload.
A role that passes only one column isn't a strong match. You can also review practical guidance such as Benely burnout prevention tips when assessing boundaries, workload design, and remote-work habits.
Read the listing for operational clues
Look for explicit markers:
- No call: Confirm whether this excludes informal phone coverage.
- No weekends: Ask about holiday rotations and make-up shifts.
- Weekday schedule: Verify start and end times, not just the number of workdays.
- Remote or hybrid: Clarify camera requirements, patient geography, and equipment support.
- Transparent compensation: Request the productivity formula and examples of how incentives work.
- Burnout-Friendly Score: Use it as a screening signal, then validate the underlying schedule and workload.
WeekdayDoc's psychiatry listings combine job filters, salary information, work-style markers, and FIRE-oriented market views. You can also use the psychiatrist work-life balance guide to define what “sustainable” means before you negotiate.
The right comparison is not the highest salary against the lowest salary. It's the highest sustainable savings rate per unit of clinical strain.
Using State Salary Data for Long-Term Career Planning
State wage tables are most valuable when treated as a moving dashboard. A psychiatrist considering relocation might compare a high-mean state with a smaller workforce against a lower-mean state with more stable employment depth. Another clinician may stay put, negotiate from the local benchmark, and use telepsychiatry to widen the employer pool without moving.
The planning horizon should include more than the next contract. Track the wage series, employment concentration, local practice mix, and the types of roles entering the market. BLS has published comparable occupational data across multiple annual releases, including 2019, 2021, 2022, and 2023, which creates a basis for reviewing direction over time, although year-to-year movement can be noisy in small state workforces.
A practical decision sequence
Use this order:
- Define the life you're funding. Set your acceptable call burden, weekly schedule, location needs, and FIRE target.
- Shortlist markets. Use state wage data to find places worth investigating, not places you must move to.
- Check market depth. Review employment concentration and the number and type of available roles.
- Normalize the budget. Compare taxes, housing, family costs, benefits, and commuting.
- Evaluate the actual contract. Separate guaranteed pay from incentives and assign a value to schedule protections.
- Recalculate annually. Update the model when your household, role, or savings target changes.
The best state for one psychiatrist may be the place with the highest mean wage. For another, it may be a lower-cost market with a stable weekday role and enough income to invest consistently. A third may stay in a preferred city and use remote work to negotiate against a wider labor market.
The headline number starts the analysis. Your sustainable savings, clinical energy, and contractual control finish it.
WeekdayDoc helps clinicians compare remote, hybrid, and in-person roles using salary information, state-level market views, FIRE projections, and clear no-call and no-weekend markers. Visit WeekdayDoc to evaluate psychiatry opportunities against both your compensation goals and the work life you want to sustain.